Photo Adventures with Curiosity and Learning
The composite map - Hover over red stick pins or cyan arrows for Oximeter data and distance data. I'm using GPS Visualizer to build the javascript interface to the Google api
The jogging track map
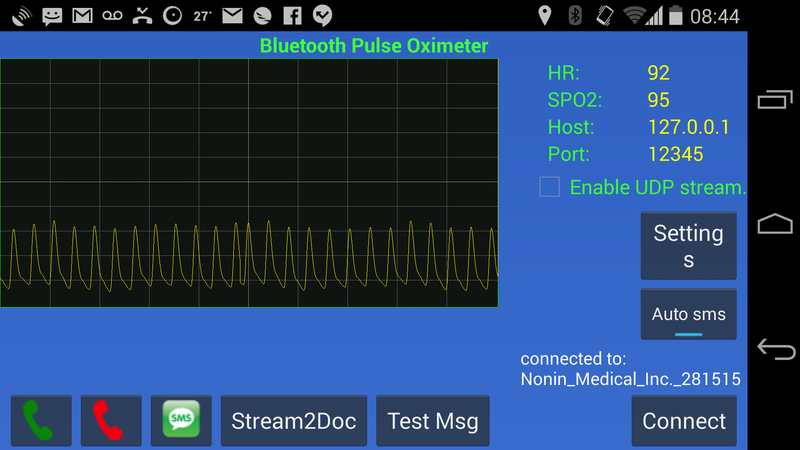
The Oximeter data annotation map
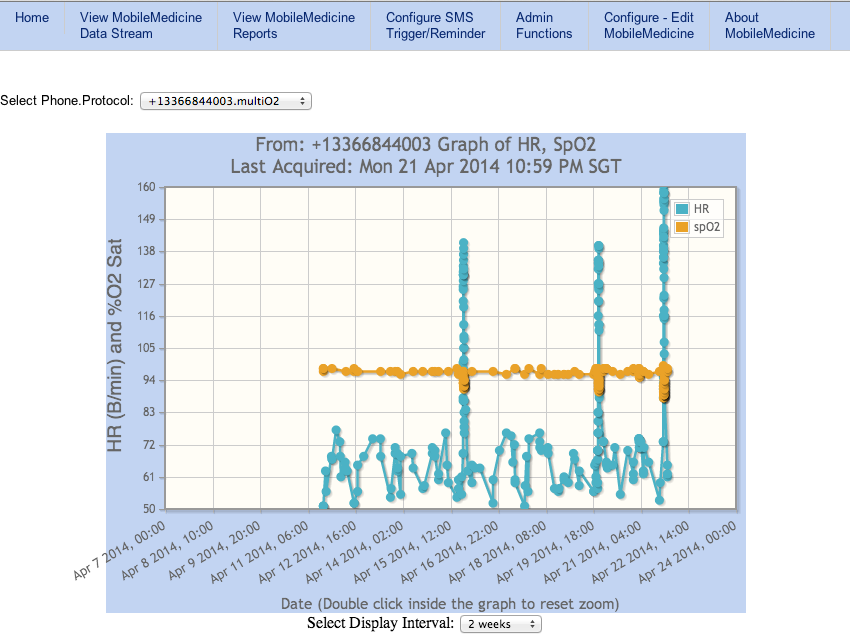
Primary data - past 2 weeks
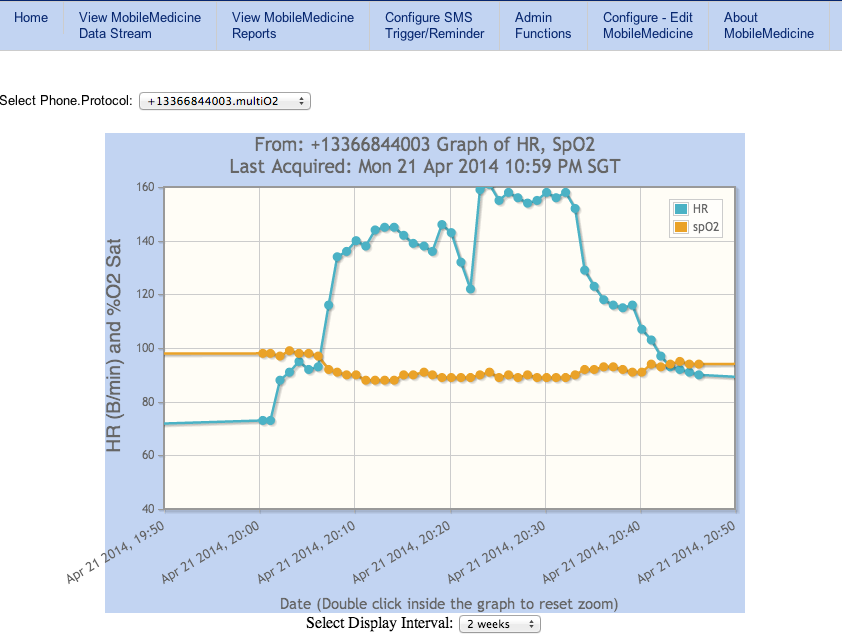
40 min jog and recovery

This work is licensed under a Creative Commons License.
C. Frank Starmer