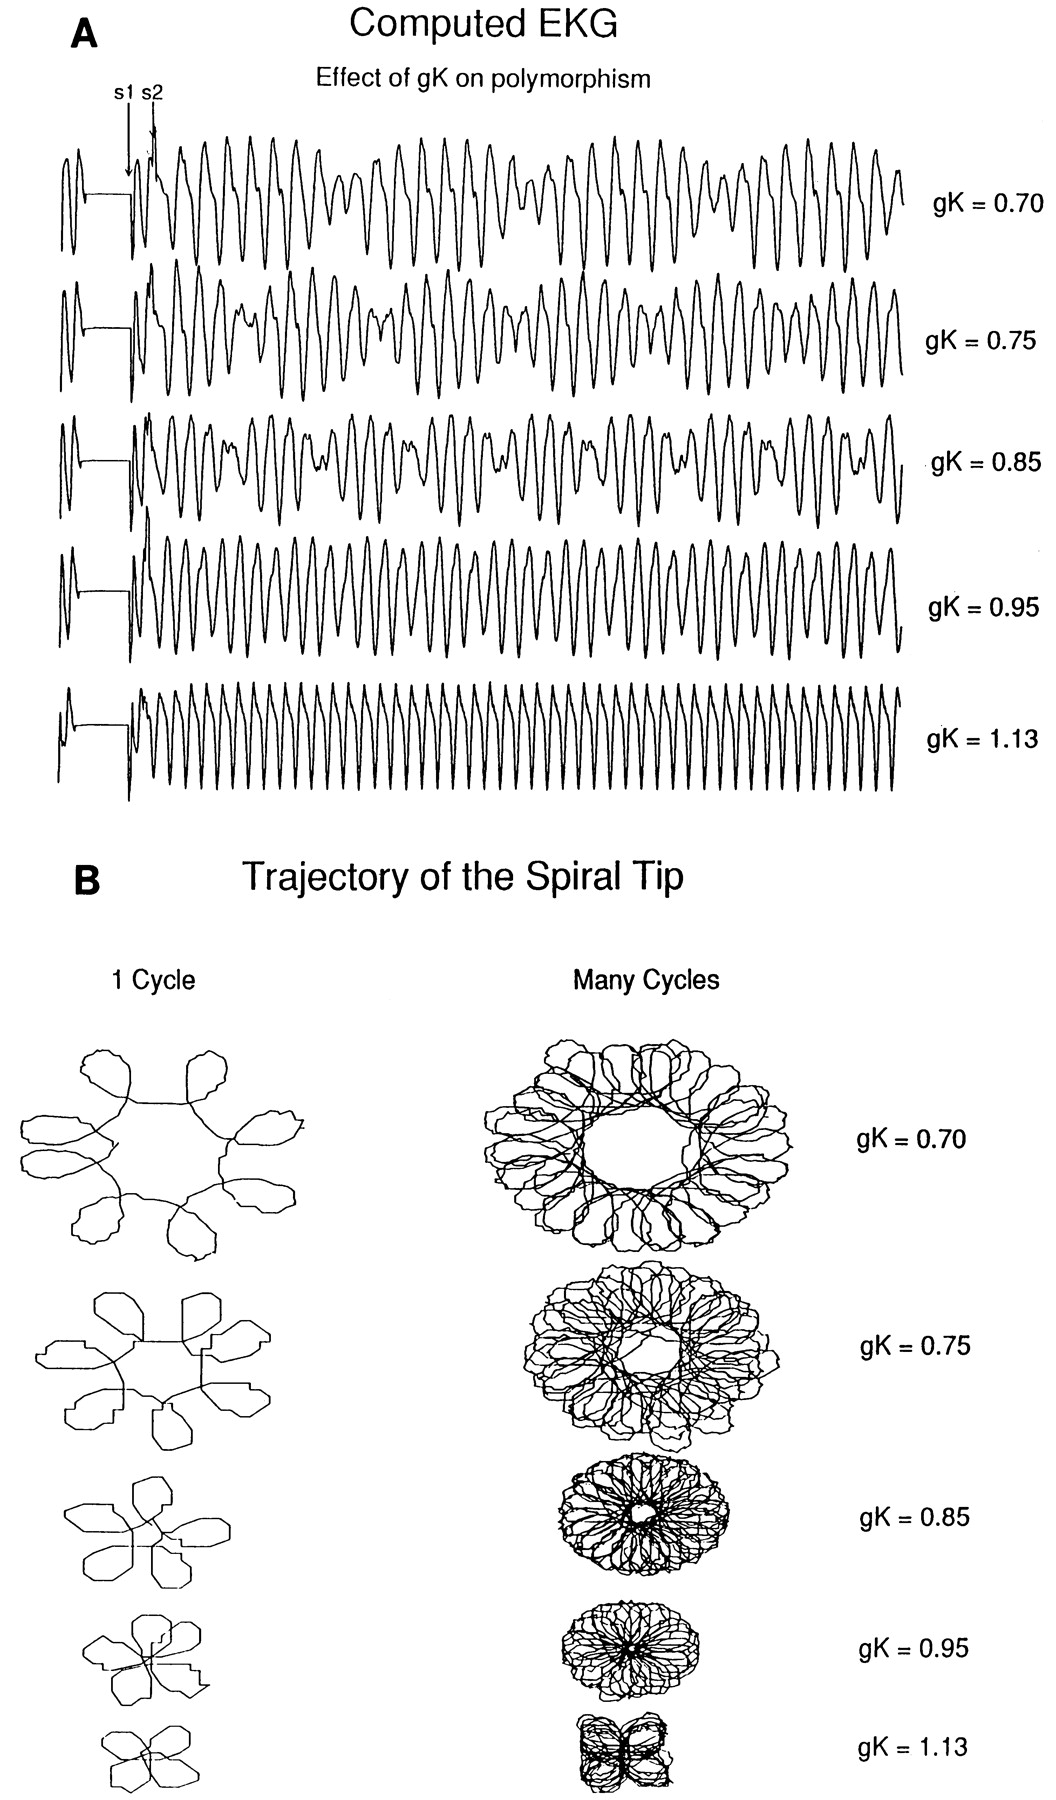
Figure 5. Computed ECGs (EKG in the figure) and tip
trajectories. A, Computed ECGs for different values of potassium
conductance (gK). B, Associated tip trajectories
computed from a 40x40 array of excitable cells. Note that as the
potassium conductance (gK) is reduced, the
morphology of each complex in the computed ECG gradually shifts from an
almost monomorphic ECG (gK, 1.13) to a
polymorphic ECG similar to that seen in torsade de pointes
(gK, 0.70). In addition, as the size of the flower
increases, the degree of amplitude modulation displayed in the ECG is
increased. The tip trajectories, shown for a single torsade cycle on
the left and for multiple cycles computed over a 50–time unit interval
on the right, change from a four-petaled flower (gK,
1.13) to a eight-petaled flower (gK, 0.70). Note
that the number of reentry complexes within each torsade cycle in the
computed ECG is approximately one less than the number of flower
petals. The number of petals is determined by the ratio of the spiral
rotation frequency to the tip precession frequency. If the ratio is not
an integer, then each flower will be rotated from one torsade cycle to
the next (as shown on the left), thus introducing another degree of
variability in the morphology of the polymorphic ECG.
[Return to Article]