

Next: Parameter Estimation Using Maximum
Up: Generating Random Variables
Previous: Generating Normally Distributed Random
Index
Click for printer friendely version of this HowTo
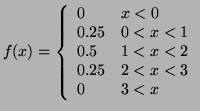
For this, let us consider the following hypothetical discrete
distribution:
 |
(3.8.1) |
Thus, with this distribution, you would expect a quarter of the data
points in a random sample to come from between 0 and 1, half to come
from between 1 and 2 and the remaining quarter to come from between 2
and 3.
In order to simulate a random sample from this distribution, we can
map it to an interval ranging between 0 and 1. This can be done by
simply taking length of each interval, multiplying it by its
probability and storing the new value in an array. For this
distribution, the first index of the array would contain 0.25, the
second 0.5 and the third 0.25. To generate the random sample, select
a random number between 0 and 1 and check if it is greater than the
value in the first index. If it is not, then the point falls between
0 and 1 in our distribution. We can then choose another random number
between 0 and 2 to determine which particular value it is. If the
first random number is greater than the value at the first index, then
we check to see it if it is greater than the values at the first and
second indices combined (0.25 + 0.5) and continue this procedure until
we have established which segment in the distribution it comes from
and then determine the exact value from that segment by choosing
another random number. This particular example has been coded in
octave and the program can be found in
Appendix A.3. A histogram of the output can be
seen in Figure 3.8.4 where the sample size was set to 200.
Figure:
A histogram of 200 simulated random variables
from generate_discretes.m.
![\includegraphics[width=3in]{discretes}](img601.png) |


Next: Parameter Estimation Using Maximum
Up: Generating Random Variables
Previous: Generating Normally Distributed Random
Index
Click for printer friendely version of this HowTo
Frank Starmer
2004-05-19